# Profile Guided Optimization
> **TL;DR**
> Use GraalVM Enterprise Edition's PGO to profile your native image at runtime and feed that data back into the next build, reducing startup time and improving throughput without touching source code.
After we restored tracing capability in [Traces In Native Image Via Datadog](traces-in-native-image-via-datadog.html), let's take a look at Profile Guided Optimization (PGO).
This technique allows you to generate a profile at runtime of optimizations that the JVM applies and bring them to build time for your next native image build.
You will need GraalVM Enterprise Edition for PGO builds.
## Setup
The first thing we need is to build a native image capable of collecting runtime data.
As in previous articles, we use the native image Maven plugin to pass the argument `--pgo-instrument`:
```XML
-J-javaagent:dd-java-agent.jar
--pgo-instrument
--initialize-at-run-time=sun.net.dns.ResolverConfigurationImpl
```
Build with
```SHELL
mvn -Pnative package -DskipTests
```
Check the logs for Active PGO instrumentation:

> **Warning:**
> Note
>
>
>
> This automatically uses optimization level 2 / -O2
>
>
>
> This will take longer to build your image and is not suitable for iterative development
Notably,
I ran out of memory trying to build a PGO instrumented native image:
```LOG
[3/8] Building universe... (10.1s @ 4.38GB)
[4/8] Parsing methods... [**] (4.8s @ 4.71GB)
[5/8] Inlining methods... [**] (0.5s @ 4.80GB)
[6/8] Compiling methods... [****************] (259.4s @ 7.40GB)
GC warning: 170.0s spent in 1126 GCs during the last stage, taking up 65.53% of the time.
Please ensure more than 9.35GB of memory is available for Native Image
to reduce GC overhead and improve image build time.
Terminating due to java.lang.OutOfMemoryError: Java heap space
The Native Image build process ran out of memory.
Please make sure your build system has more memory available.
```
The process took longer than the usual 8 minutes I was getting with -Ob quick build mode:

The binary generated was larger:

## Collect
During this phase, you would ideally use workloads similar to your production environment.
I will just send hundreds of queries through Postman's Collection runs.
```SHELL
spring_profiles_active=local DD_SERVICE=native_tst ./pgo_instrumented_app.exe
```
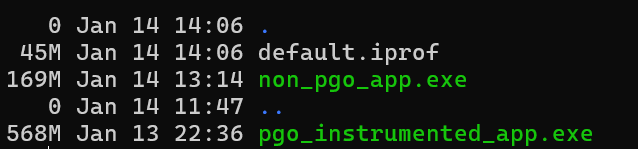
This generates a profile `default.iprof` that we will use in the next step:
## Pass the profile to Native Image
Pass the `--pgo` argument to the native image build tool:
```XML
-J-javaagent:dd-java-agent.jar
--pgo=default.iprof
```
Rebuild:
```SHELL
mvn -Pnative package -DskipTests
```
Check for Active PGO:

> **Tip:**
> References
>
>
>
> [GraalVM PGO Optimization Guide](https://www.graalvm.org/latest/reference-manual/native-image/guides/optimize-native-executable-with-pgo/)